Distributed Tracing with ASP .NET Core and Kubernetes + Istio + Jaeger
This article is going to take a look at Distributed Tracing for an application (this website) running in Kubernetes using Istio and Jaeger. The application is written in ASP .NET Core.
For reference, I’m going to cover some of the Istio setup before getting into the distributed tracing.
To quote the Istio Distributed Tracing overview here
Distributed tracing enables users to track a request through mesh that is distributed across multiple services. This allows a deeper understanding about request latency, serialization and parallelism via visualization.
Distributed tracing and service mesh technologies are interesting topics, and so I wanted to test them out and what better place to do so then this website. For more information on distributed tracing, check out the Observability concepts page and the FAQ page in the Istio documentation.
For reference the website currently looks like the below with five seperate containers. In the following setup the NGINX container is ommitted.

Istio Setup
For this article, I followed the Istio Customisable Install with Helm steps here. Noting I altered the provided command for step 5 to the following
/usr/local/bin/helm install install/kubernetes/helm/istio –name istio –namespace istio-system –set grafana.enabled=true –set grafana.service.type=NodePort –set prometheus.service.nodePort.enabled=true –set tracing.enabled=true
The available install options are detailed here. I used the following
- grafana.enabled=true - self explanatory, enables Grafana
- grafana.service.type=NodePort - set the Grafana pod to Nodeport so I can reach it from outside of the Kubernetes node (tl;dr so I don’t need a port forward)
- prometheus.service.nodePort.enabled=true - similar to Grafana this is so I can reach the Prometheus interface from outside of the Kubernetes node
- tracing.enabled=true - is part of the Istio distributed tracing documentation tasks for Jaeger found here, and it enables Jaeger
Istio Core Components
Istio consists of several components which are deployed into pods in the Kubernetes cluster. For quick reference, I’ve put a link and short description from the Istio documentation for each below.
- Envoy proxy - deployed in a sidecar proxy model “to mediate all inbound and outbound traffic for all services in the service mesh
- Mixer - enforces access control and usage policies and collects telemetry data
- Pilot - provides service discovery for the Envoy sidecars, traffic management capabilities for intelligent routing and resiliency
- Citadel - enables strong service-to-service and end-user authentication
- Galley - configuration validation, ingestion, processing, and distribution
Although this diagram is from the Policies and Security section of the Istio documentation, I find it useful to visualise how Istio works. Source here.

A little less busy is also the architecture diagram, source here.

Istio Required Configuration
Several configurations are required to setup Istio for the jasonneurohr.com pods.
- Virtual services are used to configure an ordered list of routing rules to control how Envoy proxies route requests for a service within the mesh. A virtual service is configured for the Grafana, Prometheus, Jaeger, and web pods
- Gateways are used to configure how the Envoy proxies load balance traffic and are used to route traffic in/out of the mesh. A gateway is configured for the Grafana, Prometheus, Jaeger, and web pods. The gateway definitions are bound to the corresponding virtual service definitions for each pod.
- Service entries are used to add an entry to Istio’s abstract model that configures external dependencies for the mesh. A service entry is configured for the AWS Relational Database Service (RDS)
- Sidecars are added to all pods
Below I’ve put the necessary definitions to get the web and Jaeger pods up and running. The additional pods follow similar configuration, so I’ve omitted them for brevity.
Gateway and Virtual Service Definition
The gateway and virtual service definition used for the web pod.
|
|
The gateway and service definition for Jaeger.
|
|
Service Definition
The service definition for the web pod.
Service Entry Definition
The service entry definition for the AWS Relation Database Service (RDS) backend.
Deployment Definition
The deployment definition for the web pod.
|
|
To get the URL and port for web, check the istio-ingressgateway details. Since I’m using the NodePort I already know the Kubernetes worker IP address is 10.1.43.11, the port can be found using the below commands.
kubectl get service -n istio-system

kubectl describe svc istio-ingressgateway -n istio-system

Similarly, we know Jaegar is set up on the Kubernetes worker NodeIP, and we can use the same commands above to determine the port.
Install Notes
After following the setup guides, I was only receiving tracing information for the istio-ingressgateway and not the subsequent requests. This turned out to be due to not labelling the ports in the Kubernetes service definition (note the “- name: tcp”). This is documented here in the traffic management FAQ. Once this was done the traces should the requests from the ingress through to the backend API.
ASP .NET Core Setup
To facilitate distributed tracing the ASP .NET Core application needs to propagate several HTTP headers so that the traffic can be correlated correctly, refer to Trace context propagation for more information. The headers that need to be propagated are:
- x-request-id
- x-b3-traceid
- x-b3-spandid
- x-b3-parentspanid
- x-b3-sampled
- x-b3-flags
- x-ot-span-context
To do this, I utilised a backport of the HeaderPropagation middleware which was added to ASP.NET Core 3.0 since I’m using ASP.NET Core 2.2. The backport, HeaderPropagation can be found here, and also on NuGet here. To do this follow the instructions in the projects README.md. For reference, this is my ConfigureServices() in the Startup.cs.
|
|
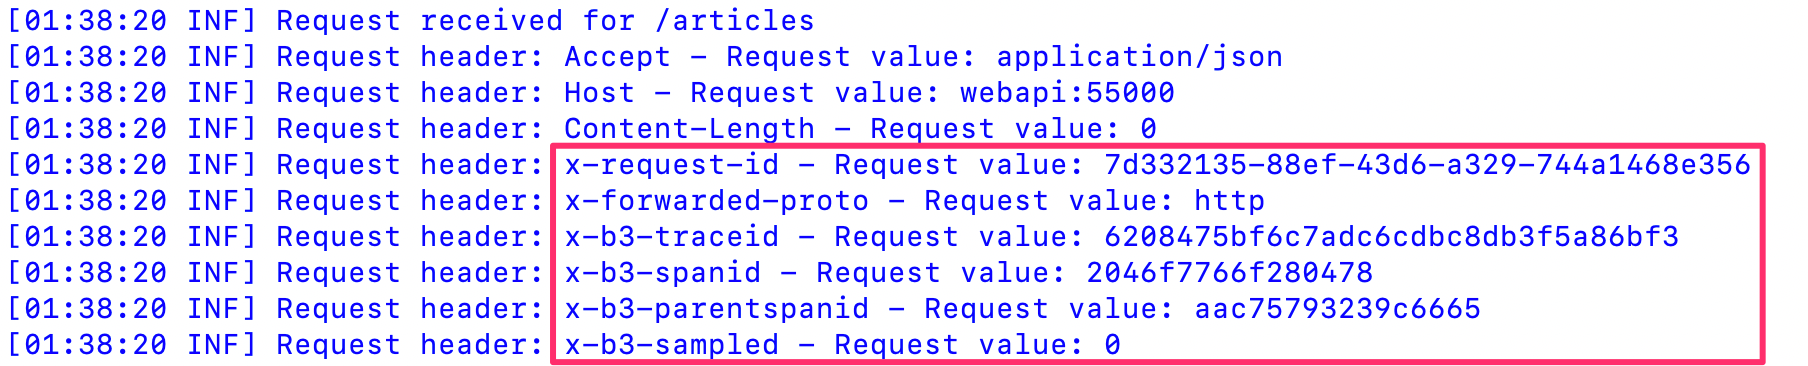
Once this is done the headers required for distributed tracing will be propagated when the frontend makes HTTP requests to the backend API.
Logs from the web container:

Logs from the webapi container:
Jaeger
Jaeger is already ready to go due to the steps taken as part of the Istio setup above, so all that’s left to do is generate some traffic and review it in the Jaeger dashboard. Following from the Istio guide here and using this handy little snippet to generate some traffic.
for i in `seq 1 100`; do curl -s -o /dev/null http://10.1.43.11:31380/; done
After generating some requests and refreshing the Jaeger interface, we can now see some trace data.

Looking at the trace, we get a picture of the flow of requests from the ingress gateway through to the backend webapi and some details and metrics we can use for reviewing performance and understanding the request flow.

[UPDATED:2019/08]
- Website container image updated to reflect that the site is now composed of five containers and preceding description updated from three to five.